Q2 2024 Market Recap
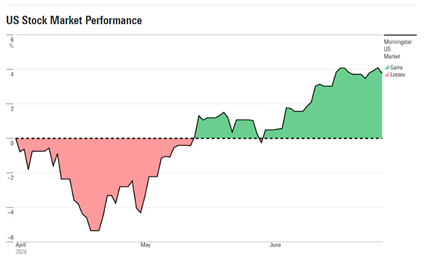
As is often the case, markets rewarded the patient investor in the second quarter. After an exceptionally strong first quarter, optimism in stock and bond markets came to an abrupt halt, as a series of unexpectedly high inflation readings and a dimming outlook for U.S. Federal Reserve rate cuts sent stock and bond prices tumbling in early April. By mid-month, however, this negative sentiment began to fade, as a strong jobs report and easing inflation outlook calmed the nerves of jittery investors. Markets then staged a remarkable turnaround (see chart to the left), led by U.S. growth stocks, finishing the quarter in positive territory.
As mentioned above, market gains were led by U.S. growth stocks, with NVIDIA alone driving 45% of the S&P 500 Index’s +4.3% return in the quarter. The growth-focused NASDAQ Composite Index ended the quarter up +8.5%, while the value- focused Dow Jones Industrial Average fell -1.3%. Unsurprisingly, information technology (+13.8%) and communication services (+9.4%) were the strongest sectors, as they include the more growth-oriented technology names. The more cyclical sectors, materials (-4.5%), industrials (-2.9%), and energy (-2.4%) all fell in Q2. In fact, only 5 of 11 sectors were positive for the quarter.
Canadian markets struggled in the second quarter (the S&P/TSX Composite Index was down -0.5%), given their high weighting to value-focused sectors (financials -1.2%, industrials -3.4% and real estate -5.7%) which are suffering under the weight of high interest rates and a weak economy outside of AI. Only 4 of the 11 sectors were positive for the quarter, led by materials and consumer staples (+7.4% and +4.2%, respectively). On June 5, the Bank of Canada lowered interest rates for the first time in more than four years, signaling the economy is transitioning into a rate-easing cycle. This is welcome news to an economy experiencing a slowdown in growth and rising unemployment, not to mention anyone renewing a mortgage!
European markets managed to eke out a slightly positive quarter (MSCI Europe ex-UK Index +0.6%), with the European Central Bank also kicking off their rate easing cycle in June. Internationally though, it was emerging markets that stole the show (+5.7%), driven by AI gains in the technology sector, stabilizing growth in China, and continued GDP growth in India (they are now on pace to surpass Japan and Germany as the world’s third largest economy by 2027).
Fixed income investors faced a difficult start to the quarter as they adjusted to scaled back expectations of interest rate cuts. However, by quarter’s end, inflation concerns had eased and yields began to fall, sending prices higher. The FTSE Canada Bond Universe gained 0.9% in Q2, while the Bloomberg Global Aggregate Bond Index gained 0.7%.
OUTLOOK
As we’ve said many times in the past, as long-term investors, we aren’t in the business of trying to time the markets or make bold calls on the economy. While those things make good headlines or soundbites, they generally don’t support long-term investing success. We do, however, have to be mindful of the risks and opportunities presented by markets and be prepared to make adjustments if the risk and reward of the holdings/allocations within our portfolios change. With markets today seemingly awash in contradictions, below are a few of the things we are closely watching.
Complacency
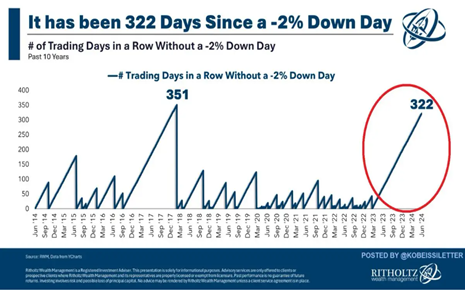
The year 2024 has seen remarkably little volatility. In fact, as shown in the graph below, in the past 10 years, there has only been one other period where we’ve experienced a longer period without a 2% down day (*as of the end of June we are now at 340 days and counting). This kind of trend can lead to complacency and a false sense of security among investors. If you see the same thing enough times, you can start to believe that nothing else is possible.
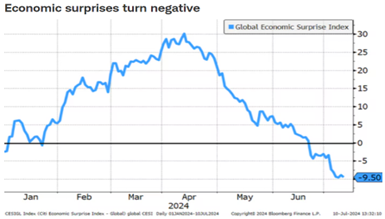
Investors today may be falling into that trap. With the topics of interest rate cuts and AI dominating market conversations, markets marched to new all-time highs repeatedly in Q2. At the same time, however, economic data weakened relative to expectations and, by the end of the quarter, the Global Economic Surprise Index had been pulled into negative territory (see chart below), meaning economic data was generally below forecasts. Weak economic surprises are generally not welcomed by markets and if this trend continues, markets, which have largely ignored it to this point, may be less tolerant.
The overwhelming consensus today is that the U.S. economy remains on firm footing and is on track for a soft landing. In our experience, markets rarely act exactly in line with the consensus. While the same themes that have worked in the first half of the year may continue their momentum in the third quarter, the contrarian streak in us tells us we should prepare for more volatility and look to some of the overlooked areas of markets in the coming months.
FOMO (fear of missing out)
It’s hard not to feel an element of FOMO when reviewing market returns over the last few months. Dave McGarel, Chief Investment Officer at First Trust Advisors L.P., explained it like this: “Investors with too little exposure to the Magnificent 7, AI stocks or the technology sector are tempted to enter the space. They worry about missing out on future gains and falling even further behind their friends. And investors with huge gains in those areas are concerned about selling their winners in case they continue to climb. They don’t want to leave the party too soon”.
The Covid lockdowns, social networks (like Reddit), and the rise of social media influencers have helped create a new generation of risk-seeking investors who approach the market more like a casino than a method of building wealth. This led to the “meme stock” craze in 2021 (which also made a bit of a comeback in the second quarter) and has also contributed to the gains in the Magnificent 7 and AI stocks. While much of the rise can be attributed to their earnings growth, it, more recently, feels as if investors’ desire to pile into these stocks has less to do with their earnings potential and more to do with not wanting to miss out on the next potential leg up.
Chasing returns is rarely successful and while trimming overweight positions in these stocks could feel painful if they continue their positive momentum in the short term, it may prove to be a prudent decision for long-term investors. The valuations for these stocks are at high levels, leaving little margin for error and making them more vulnerable to significant pullbacks, which tend to be more extreme in crowded trades.
Concentration
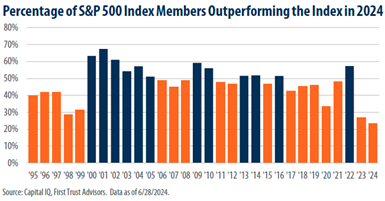
For most of this year, pundits and strategists (ourselves included) have expected the market’s rally to widen beyond technology, yet as mentioned earlier, the S&P 500 Index’s gains have been concentrated to just a handful of stocks. Just eight stocks (NVIDIA, Microsoft, Alphabet, Meta Platforms, Amazon, Broadcom, Apple, and Eli Lilly) have accounted for roughly 70% of this index’s gains in 2024. In fact, less than 25% of stocks in the S&P 500 have outperformed the index, which is the lowest percentage in 30 years (see chart to the left), and half the historical average rate.
Against this unprecedentedly narrow backdrop, and with earnings outside the Magnificent Seven expected to accelerate, investors may want to consider re-allocating some funds to other more undervalued areas.
In his third-quarter outlook, Morningstar chief U.S. market strategist Dave Sekera wrote: “While a rising tide can lift overvalued AI stocks even further into overvalued territory in the short term, in the future we think long-term investors will be better off paring down positions in growth and core stocks, which are becoming overextended, and reinvesting those proceeds into value stocks, which trade at an attractive margin of safety”. Dividend payers and more specifically dividend aristocrats (companies that not only pay a dividend but have a long history of continuously raising dividends) seem particularly undervalued. So far this year, the dividend aristocrat indices in both the U.S. and Canada have been soundly beaten by the broader indices (S&P 500 Index +15.3% vs. S&P Dividend Aristocrats Index +2.2% & S&P/TSX Composite Index +6.1% vs. S&P/TSX Dividend Aristocrats Index +3.2%). With many dividend yields between 4% and 7%, this is likely the area to be searching for bargains.
As always, we welcome your comments and questions.
Sincerely,

This Quarterly Market Commentary has been prepared by Ryan Cramp and Michael Higgins and expresses the opinions of the authors and not necessarily those of Raymond James Ltd. (RJL). Statistics and factual data and other information are from sources RJL believes to be reliable but their accuracy cannot be guaranteed. The client account performance may vary from the model portfolio due to several factors, including the timing of contributions and dates invested in the model. The performance reported is that of the account that represents the model, not a composite. Performance calculation for the models may be different than the index used as a reference point. It is for information purposes only and is not to be construed as an offer or solicitation for the sale or purchase of securities. This Quarterly Market Commentary is intended for distribution only in those jurisdictions where RJL and the author are registered. Securities-related products and services are offered through Raymond James Ltd., member-Canadian Investor Protection Fund.
Raymond James Ltd. has managed or co-managed a public offering of securities within the last 12 months with respect to Capital Power Corp., goeasy Ltd., WSP Global Inc., and Intact Financial Corp.
Raymond James Ltd. has also provided investment banking services within the last 12 months with respect to Capital Power Corp., goeasy Ltd., WSP Global Inc., and Intact Financial Corp.